

Let us say you are a betting person. Let us say, just for argument, you are somewhat less than average intelligence. You are been told that it rained in a locality in September, the last 7 of the 8 years. It would be reasonable for you to bet that it would rain this September too.
And, you would probably get it right.
But nobody would say you are a remarkable seer. Neither would anyone blame you for being wrong if it didn’t rain this September. In all likelihood, your prediction would have been forgotten because a hundred other people said the same thing.
But, let us say you are an economist.
Suddenly, you would become a remarkable seer. And, if wrong, you can count on other more intelligent people to come up with even more intelligent explanations. And if you are right, you can use that to become an even more eminent economic seer the next time around.
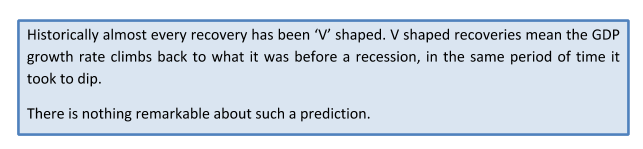
Most economic recoveries have been ‘V’ shaped
Look at this chart as an example using data available at World Bank for India and the USA[1].
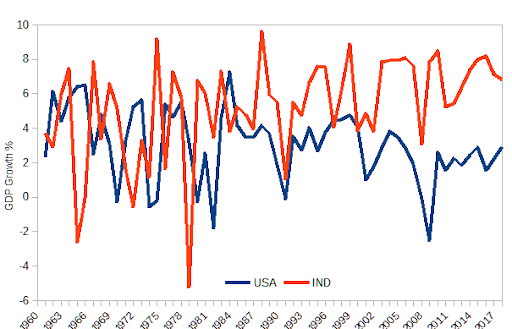
The big recent recessions did not hit all countries exactly at the same time but were in and around 1969, 1973, 1980, 1981, 1990, 2001, 2007.
Here’s a chart from JP Morgan that shows how most recoveries have been ‘V’ shaped[2].

A popular adage attributed to Marie-Antoinette was about her saying “lets them eat cake.” Luxury food when people didn’t have bread. She was of course gruesomely executed on the guillotine. In a modern democracy, we have only the ballot. Unfortunately, economists are subject neither to the guillotine nor the ballot. Only monarchs and politicians.
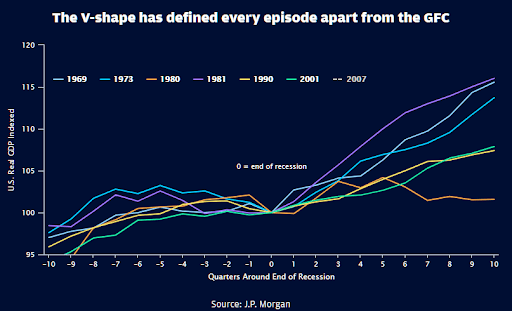
1. Poor people fall faster and recover slower
In the 1990 recession as an example, the US added 10 million people to poverty. While the ‘V’ shaped recovery happened by 1992, it took 10 years till 2000 to pull back the 10 million from out of poverty.
It does not look like ‘V’ for victory for the poor.
2. Employment to previous levels takes longer
The following is a chart created again based on USA data simply because the US is the most transparent with data[3]. Granted even this has nuances and may not have 1:1 correspondence with India. But directionally, what is obvious is that the Employment ‘V’ is much broader.
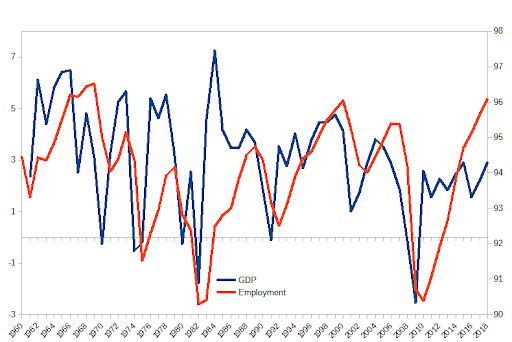
What we seem from GDP percentage vs the Employment rates, is that employment takes a lot longer to catch up with erstwhile levels. For example, the GDP percentage was ~ 3.5% in 1989, which fell and rose back to ~3.5% levels in 1992. But employment which was at 94.7% in 1989 only reached back to similar levels in 1996.
So, a whole bunch of unemployed aren’t going to be cheerleaders when they hear speeches on how the economy has rebounded. Of course, this matters only to mass leaders and not to bureaucrats or economists.
3. Income Disparity is Compounded
There are many measures of income disparity like the Gini coefficient. But, here are 2 simple charts created from data at the US Census government site[4].
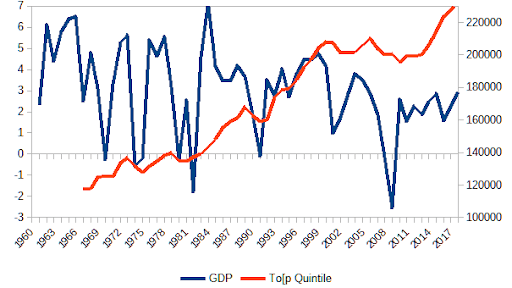
The above is data of the median household income of the top 20% of the US. Not only is this population able to recover in lockstep with economic recoveries, but there is also a broad secular upward movement of incomes.
The rest aren’t so fortunate. Here’s data for the bottom 20% of the population
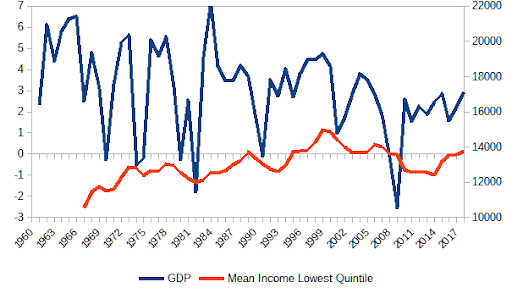
Their ‘V’ is not so sharp. Nor are they seeing the secular upswing of their well-heeled fellow citizens. Using the 1990 recession as an example, it took this population up to 1996 to get back to the same income levels they had in 1989. The top quintile had recovered by 1991 and by 1996 was at 110% of their 1989 income levels.
Apart from economic consequences, this sort of disparity caused by recessions is the ripe petri dish for cooking social unrest.
Summary
The Pandemic has created a new ‘P’ equation. Political dividend (P) = Performance (P) x Projection (P). To paraphrase Marie-Antoinette, ‘let them swallow the projections’ will work only as long as there is performance. Only a massive government-led demand program can lift all sections of society and instill confidence. Political leadership with their pulse on the people can surely see that.
Note:
1. The views expressed here are those of the author and do not necessarily represent or reflect the views of PGurus.
References:
[1] World Bank Open Data – World Bank Group
[2] What Will the Recovery Look Like From the COVID-19 Recession? – Apr 10, 2020, JPMorgan
[3] Databases, Tables & Calculators by SubjectPRINT: Print – Bureau of Labor Statistics
[4] Income Inequality Data Tables – US census Bureau

- The uneducated Hindu - May 15, 2020
- V shaped economic recovery - May 9, 2020
- Economic escape velocity from a pandemic - April 29, 2020


")


I am posting another comment on reference made by Srinivas and also author on govnt spending.
In case of govnt orders which are on infra , can be executed only with the help of migrant labour. These labourers are procured by a tekedar from different states as Contractors do NOT have mechanism to identify suitable and skilled labour.
In one of my stints as a manpower supplier in a Middle East city which only depends on international migrant labour, their accommodations were separately built in a separate town ship, though few were staying in city area old villas. All the employers in the city as per contract have to provide accommodation and transport to the site. The accommodation is 6/8 people a room with A/ C, dorm toilets and dorm kitchens ( for self cooking ) with grocery facility. Usually these town ship blocks are owned by Arabs and rented to Companies. In case of field sites away from labour camps, hired porta cabins are used for labour accommodation.
Though an engineer, I chose an unconventional line because I knew the criticality of the field with good returns. As pucca constructions cannot be made in India, at least discarded shipping containers, with remake can be used for accommodation. I see labour accommodation from my residential block which are worse than goshalas. They are made of GI walls and roofing with open air bathing.
For all new Cos, the govnt should built accommodation for labour where there are a group of industries or pay the industry to built labour accommodation. This costs negligible compared to providing freebies to people. I can run a factory with part time accountant, part time manager, part time sales man but cannot without qualified labour.
Every migrant should have a supplementary labour ID issued by Home state, so that he can avail benefit at guest state. The initiative by UP govnt on labour laws is excellent and corona has brought reality to light.
While author is an engineer and MBA, I am sure he never ran a business with order from govnt. How does the govnt spend money on projects ? We have highly manipulative tender system where only an undeserving or Dalals will get order. Usually these orders are sublet and the projects will move at snail pace. Do you know how long it took to construct 2nd Howrah bridge ? 20 years. Ask any contractor, how many people he has to bribe to get a govnt cheque . Some govnt bills are pending for years together, in fact the cheque writer has more power than PM.Things May have changed slightly better, but only for central govnt projects only. What about state govnt contracts, when regime changes ? For ex Maharashtra govnt put on hold metro sliding, put on hold bullet train projects. In AP, capital city project cancelled. Polavaram , India’s largest irrigation project stalled as new govnt cancelled running order of main contractor. In some cases, courts interfere and projects gets stalled.
This V curve theorem applies only when we have a mechanism like earth going round sun and it may work in US and few European countries, where payments are made as per contract and have a perfect legal system.
There is no value for engineers and MBAs in India as they have to work under owners though not qualified but are excellent financial planners and manipulators. Hence the option for growth is encourage massive private enterprise rather than govnt orders controlled by Babu mafia. Further analyse how massive weddings and frequent elections spread money in the society. In case of weddings, money goes to jewellery makers, dress makers, interior contractors, floral suppliers, food caterers, musicians, photographers, cab suppliers, hotels, manpower contractors etc. For critics, here money is not wasted but circulated.The same logic applies to elections where beneficiaries are liquor manufacturers, garland suppliers, stage contractors, Mike and lighting suppliers, tent and furniture hirers, flex banner and flag suppliers, safety pin suppliers etc. where is this people’s money wasted ? It is again distributed to people.
Now the picture is clear about migrant labour. It may sound ridiculous, but India has severe labour shortage in southern states. Also Indian economy is standing on migrant labour from Bengal, Bihar, UP and Orissa which I realised 15 years ago. To move further, unless we analyse how we create a buffer of labour force, we cannot grow industrially.
Sir, US is a capitalist economy. Is this also a reason for disparity in V shaped economy ?
Very nice article with specifics. My only comment is, as Indian economy is driven by NBFC, where involvement of Govt. is very low. Even Mudra act was supposed to drive this, but could not have any impact. In this circumstances how Govt. can create demand needs to be seen
25% of income was to be spent on charity by every individual, family as per sanathan dharma. Now there are no such things. Probably in US the old get their social security, as I read and heard. In India there is nothing for any body. The politicians have been keeping the poor there perpetually. For the first time in my life I understood that almost 50 crore to 60 crore population consists of migrant workers and labourers. Why can’t Government form a consortium with Tatas, Birlas, Pallonjis, Ambanis, Adanis and construct 2 room pucca dwellings in cities and house migrant workers (Rents to be paid to the consortium by the companies/contractors who engage these workers and nominal rent by the workers when they don’t have work. It is pathetic that there are no proper toilets in many construction sites, even for the female labourers. Shame to all of us.
God bless India
well said