Collapse of US HB2.0 underway
The US housing bubble 2.0 collapse is actually underway as we speak. Most banks are already internally realizing the same, courtesy, the-as-yet-unrecognized losses in their MBS portfolios. The scale of these losses is indeed far higher than even the worst recorded losses post the 2008 burst. Bank of America, for example recently reported a $48 B profit for the first 6 months this year without accounting for the losses in their “held to maturity” portfolio. Accounting for the same, Bank of America would have had to report a near $48 B loss. The Federal Reserve, being the largest holder of these types of long-dated bonds, must have known this for some time now.
Of course, when the burst is recognized publicly due to the failure of some large banks in the weeks ahead, it will be described as a black swan event that could not have been foreseen. Yet, this was as obvious as it could possibly get. For the uninitiated, I would refer to my earlier articles on this theme – Why 2023 has to be worse than 2008 – Part 1[1](January 2023), Why 2023 has to be worse than 2008 – Part 2[2](March 2023) and Is there a conundrum in the US housing market?[3](September 2023).
As Mark Twain observed, History never repeats itself but it does often rhyme. Of course HB2.0 of 2023 rhymes with HB1.0 of 2008, but for us today, far more important than the rhymes are the variances. The consequence of these variances has not been remotely priced in any of the rate-sensitive asset classes as yet – stocks, bonds, and real estate. These assets are trading oblivious of the crisis that lies dead straight ahead. I am saying this after recognizing that the 30-year US treasuries have lost almost 50% of their value since the rate hiking cycle began 18 months ago. What lies in the years and decade ahead is far worse!!!.
The Rhymings with 2008
I will start with the most important but never mentioned similarity i.e. THE causative factor of the bubble. These bubbles are engineered by the US Fed (and by the respective Central Banks in other countries) with their ultra-loose monetary policy. It was the artificially low interest rates i.e. the 1% ARMS that led to the 2008 bubble while the current bubble is a function of nearly 15 years of ZIRP and QE. Remember that both these – ZIRP and QE – were unheard of before 2008.

Ultra-loose monetary policy is a necessary and sufficient condition for the formation of these bubbles. All other factors – unregulated system, greedy banks and their predatory lending practices, reckless gambling by investors, etc. are all incidental to the cause. In fact, these are all used as explanations to hide the one true cause i.e. monetary inflation perpetrated through Central Banking.
If a few years of sub 2% Fed funds rate and virtually zero QE can lead to the GFC, what would 15 years of ZIRP and an eight-fold increase in the Fed balance sheet (thru QE) lead to? Surely the GFC of 2008 is going to resemble a Sunday school picnic compared to what lies ahead.
The bubble also typically breaks when the Fed increases the Fed funds rate. This happened with Greenspan raising the rates between 2004 to 2006 (from 1 % to 5.25%) and now Powell raising the rates from 0 to 5.25% over the last 18 months. That said, all bubbles eventually find a pin and the Central Bank tightening is not a mandatory condition. However, it would be pretty embarrassing to Central Bankers if the bubbles burst without any “seemingly hawkish” measures from their side.
There are other similarities to 2008 in terms of events that happened just prior to the crash and we can observe the same patterns today as well.
Similarities – Crash in Existing Home Sales
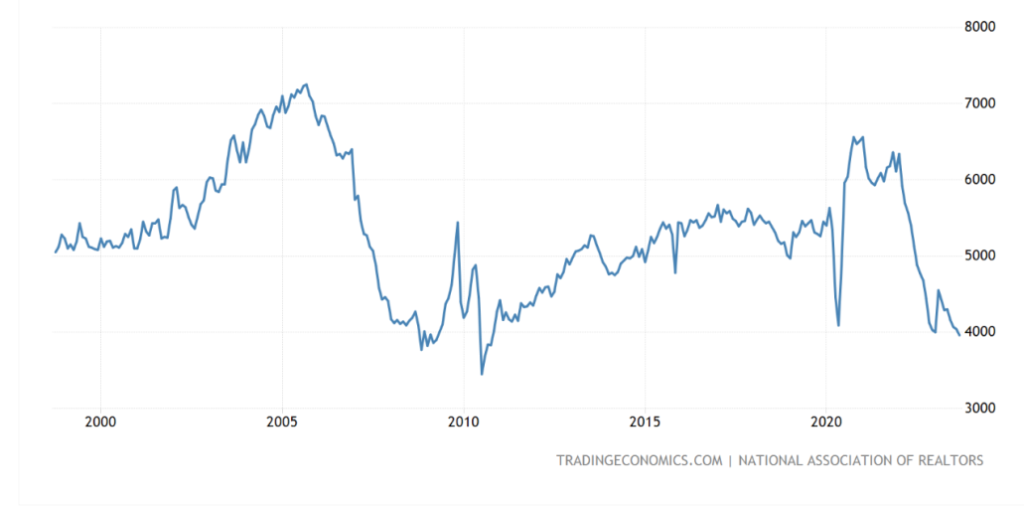
Much before the bubble breaking is recognized by the markets, the sales of housing units begin to falter – high prices, unaffordability, and rising rates being the usual suspects. Much like prior to the 2008 crisis, we have had faltering sales for nearly 2 years now. At the current annualized sales rate of less than 4M units during Sep 2023, this is the lowest recorded rate since Oct 2010. & the bubble has not even officially burst as yet.
Similarities – Declining Housing Affordability

The US Housing Affordability Index – a calculation that takes into account income, sales price, and interest rates – is now at a level that has not been witnessed since the early eighties. Much as happened during 2005 to 2008, a combination of rising prices and interest rates makes US housing unaffordable to the consumer.
There are other similarities as well – a plunge in new mortgage applications, surge in foreclosures, inventory build-up, etc. But as stated earlier, the variance is much more important than what is similar to the 2008 crisis. That is what will determine the outcomes going ahead.
The Variances with 2008 – Debts, Deficits and De-Dollarization

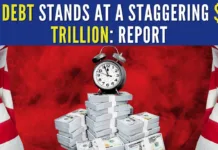
Debt – The US National Debt measured as a percentage of the GDP was in a range between 55 and 65% during the period 1990 to 2008. From that point onwards, the government debt as a percentage of GDP has increased substantially and now is at more than 120% of GDP. In absolute terms, the National debt has almost quadrupled from about $9 trillion during 2008 to nearly $34 trillion today.

The interest payments on this national debt as a percentage of tax revenues has exponentially increased from less than 20% just 2 years ago to more than 35% today. Even a moderate recession – leading to a double whammy of declining tax revenues and increasing debt – could well see this number reach 50% in the next few years. It is indeed a very probable scenario.
Deficits – The deficits of the US government over the last 4 years has been nearly 80% higher than the deficits incurred post the 2008 crash (4 years of 2009 – 2012 cumulative deficits of $5.1 trillion Vs 2020-2023 at $8.98 trillion). The FY 2023 deficit at 1.7 trillion – and this is supposedly at a time of economic strength, low unemployment, and still low-interest rates (effects of rate increases have as yet not flown through to the interest outgo) – indeed reverses the declining deficit trend of the previous 3 years.
So the deficits of the recent years are substantially higher today even when compared to the immediate post-GFC years. When compared to the pre-2008 period, the deficits today are several times than what we experienced at the start of the century. THE CBO’s future projections (and these have historically always underestimated the deficits) show increasing deficits for the next several years from even the current elevated levels. Essentially, the US government has been on a spending binge.

De-Dollarization – The term has been used to traditionally mean the shift in other Central Bank preferences for holding USD as a reserve asset. While that is a very relevant and ongoing process that will continue for at least the decade ahead, a more important trend would be that of individual investors’ preference change from financial assets to commodities. This change represents a movement away from paper assets (stocks and bonds representing the USD) towards hard assets (commodities).
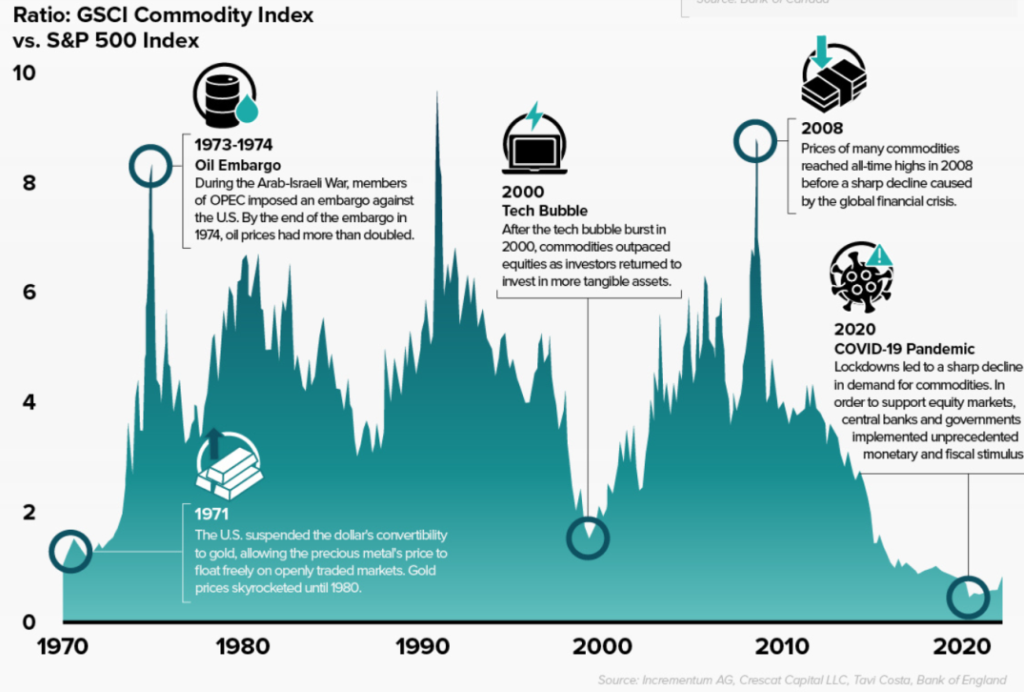
The period leading up to GFC in 2008 saw exactly the opposite trend at work e.g. a movement into commodities wherein the GSCI Vs S&P 500 ratio was at a near-all-time high of 8+. That same ratio today is around 1 and this is even lower than the 1971 value when Nixon closed the Gold window. What lies ahead is the exact opposite of what happened post-2008 in terms of investor preference for hard assets as compared to the paper assets of stocks and bonds.
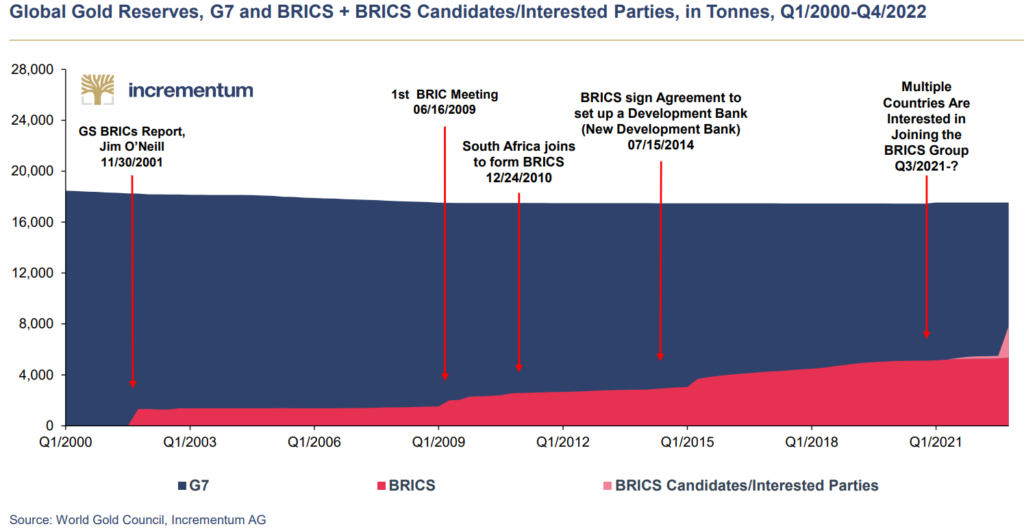
The other much-talked-about De-Dollarization is the shift to Gold as the primary reserve asset for the Foreign Central Banks. While this was a trend even before 2008, it has intensified post the GFC and has indeed gained momentum over the last few years. We are indeed entering a period when some of the large Central Banks (China, OPEC, etc.) are actively pursuing a strategy of selling USD and buying Gold.
What do the 3D’s – Debt, Deficits, and De-Dollarization – foretell?
Before that, we should also understand that these factors are not independent variables and influence one another to the detriment of the USD and the US Economy. Some examples are given below:
- De-Dollarization increases the prices of commodities which would increase the CPI leading to higher interest rates.
- Higher debt automatically means higher budget deficits (due to outgo in interest payments on the National debt).
- At this juncture, higher deficits also mean higher interest rates required to find buyers for the additional debt to be sold/ monetized by the Fed. These higher interest rates would have a dampening effect on the US Economy as well.
The three factors indeed feed on each other and the combined effects are what will lead to the next crisis. When the US Fed launched the ZIRP & QE programs post the 2008 crisis, the US Economy had relatively low levels of debt & deficits. More importantly, the trend of this new monetary inflation flowing into stocks/ bonds and real estate ensured that the flow through to consumer price inflation was long delayed. However, at this juncture, not only will the Fed have to contend with the immediate effects of the new monetary inflation they will create, but also the delayed effects of 15 years of loose monetary policy. In fact, we are set for an inflation Tsumani in the years ahead.
So the bursting of HB 2.0 is most definitely not going to be a GFC 2.0. More likely it’s going to be a Global Currency Crisis. In that sense, history is hardly going to rhyme in the post-bubble burst scenario.
Conclusions
The global economy is in unchartered water and there are no historical comparisons to the World reserve currency being in such a precarious situation as the USD is in right now. Even when the USD replaced the GBP as the world’s primary reserve asset during the mid-1940s, it was a relatively smooth transition between two “relatively” friendly nations.
The one solution that should not be attempted post the impending burst of HB2.0 is what we did post HB1.0. But Murphy’s law will work – and that same loose monetary policy is exactly what would be attempted again. Albeit in a modified form. While ZIRP can be ruled out because of the high consumer price inflation, we are indeed going to witness QE on steroids. All that the supposedly 15 years of nearly uninterrupted economic expansion post-GFC has given us are massive debts and deficits. Even according to the Keynesian playbook, we should be running massive surpluses today and yet, we see the exact opposite. Will the world ever learn that the solutions do not lie in reviving animal spirits, deficit spending, and loose monetary policies?
Ironically the solutions that would work are quite simple – at least from a theoretical perspective. All that we need is a return to the basic principles of Capitalism i.e. limited government and sound money. In some sense, the markets will move the governments towards that; but we can be sure that the governments would move in that direction only after trying and miserably failing at implementing all other witch-craft economic ideas.
Note:
1. Text in Blue points to additional data on the topic.
2. The views expressed here are those of the author and do not necessarily represent or reflect the views of PGurus.
Reference:
[1] Why 2023 has to be worse than 2008 – Jan 05, 2023, PGurus.com
[2] Why 2023 has to be worse than 2008 – Part 2 – Mar 21, 2023, PGurus.com
[3] Is there a conundrum in the US Housing Market? – Sep 21, 2023, PGurus.com
For all the latest updates, download PGurus App.
- 2008 Redux? YES and NO - October 23, 2023
- Is there a conundrum in the US Housing Market? - September 21, 2023
- Why the Fitch downgrade doesn’t make sense - August 14, 2023




Great article but there is one point I cannot understand.
If the housing bubble is about to crash, then housing prices should come down, but at the same time you are saying that we are in for an inflation Tsumani in the years ahead – so real estate would go up?
Which is it? I live in Sydney Australia and the real estate market has gone mad.
USA has for very long had its $ unreasonable inflated & went to print limitlessly. Further, it engaged in worst possible karma of bombing nations in name of democracy, waged wars, toppled govts, supported military dictatorships. Its karmic cup is filled to the brim. Nature will action on all that accumulated bad karma. They stole data, played bad games with data, now developed AI tools, doing every unimaginable wrongs with technology, America is a devil personified !! Do not require Satan to play the role, America does best in role of Satan
Do not know what supremacy they have gained.