Honest, responsible and competent media should present all relevant statistical facts, not just what they want people to believe.
“When a statistician has his head in an oven and feet in ice, on average he should feel fine.” (Anon)
Politicians, TV anchors, writers, and salespeople often feed us with statistics, misinterpret the meanings/ inferences (or deliberately let us do the misinterpretation by ourselves). Some of these statistics may be presented with an intention to deceive, but often they also interpret them wrongly because of their own inadequacy.
Let’s see why statistics could be worse than damned lies, with some simple examples:
1. “Inflation was 3% in March 2017, and 5% in April 2017; so prices are rising.”
Not necessarily true, because the base period for the 2 months is different. If CPI (Food Items) was 100 in March 2016, it is 103 in March 2017. In April 2017, it could have been 97; if so, in April 2017, it will be about 102. We can see that despite higher inflation in April, the prices were lower in April 2017 than in March 2017. So, we should not consume statistics peripherally. Even professionals like economists often misrepresent. We should seek all relevant data objectively before coming to a conclusion.
2. Do you prefer 8% Interest on your FD when inflation is 3% or 9% Interest on your FD when Inflation is 5%?
Inflation is a measure of purchasing power. When inflation is 3%, relatively, compared to a year earlier, you can purchase Rs.3 worth items less (for every Rs.100) now with the same money. So, if your Interest Rate on FD you start now is 8% with 3% Inflation, it means you’ll get approximately 5% net over today’s prices next year. If your Interest Rate on FD is 9% with 5% Inflation, it means you’ll get approximately 4% over today’s prices next year. So, the former is preferable to the latter.
But most of us have a fixation on the absolute Interest Rate.
3. Country (Company) X is willing to fund a USD 1Billion Project with 80 % loan at 0.1% Interest Rate, repayable by EMI over 50 years; Country (Company) Y is willing to deliver the same Project at half the cost, i.e., USD 0.50 Billion with 80% loan at 6% Interest Rate, repayable in EMI over 50 years. Which of these is the better option and why?
Please go to any EMI Calculator site and try to fill in these values and see the EMIs.
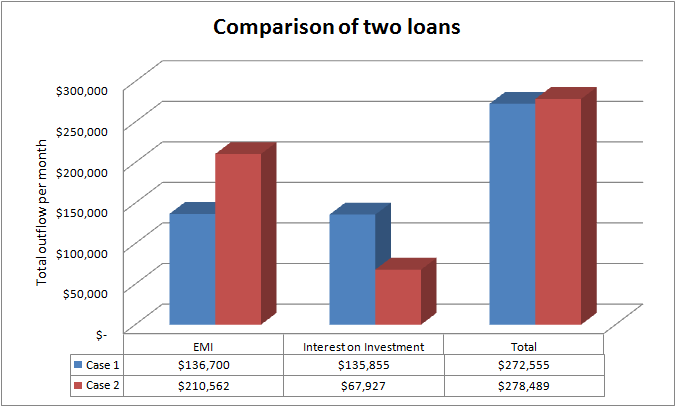
In Case 1, the Loan is USD 800,000, but the EMI will be: USD 136,700 pm.
In Case 2, the Loan is USD 400,000, but the EMI will be: USD 210,562 pm.
In Case 1, our own investment will be USD 200,000. Assuming the Cost of our own Capital is 8%, EMI payable on it for the same 50 years will be USD 135,855.
In Case 2, our own investment will be USD 100,000. Assuming the Cost of our own Capital is again 8%, EMI payable on it for the same 50 years will be USD 67,927.
So, in Case 1, Total Outflow per month is: USD 136,700 + 135,855 = USD 272,855.
In Case 2, Total Outflow per month is: USD 210,562 + 67,927 = USD 278,489.

So, we can see that, even when the loan is just a half and our own investment is also a half, that option is costlier. When the values of the variables are not uniform, (e.g., Loan Tenure, Loan Repayment Holiday, Loan/ Project-Cost ratio), we can still calculate and make the right comparisons.
Incidentally, this is similar to the Bullet Train Project. Please read my article on it at: “How Bullet Train Is Commercially Viable”
Poll of Polls is the average of seats projected by different pollsters. How scientific is it?
4. “Rich-poor divide is widening; so, the condition of the poor is getting worse.”
Not necessarily true. Let’s say, in Economy Model A, the average wealth of the poor was Rs 100, thirty years back, and it is now Rs 10,000. Let’s say, the average wealth of the rich was Rs 10,000 thirty years back, and it is now Rs 100 crores.
Let’s say, in Economy Model B, the average wealth of the poor was Rs 100, thirty years back, and it is now Rs 5,000. Let’s say, the average wealth of the rich was Rs 10,000 thirty years back, and it is now Rs 1 crore.
In model A, the rich are getting far more richer, but the poor are also getting relatively richer. Whereas, in model B, the rich are getting much less richer, and the poor are getting even less richer. In absolute terms, the condition of the poor in Model B is worse than in Model A.
What is important is NOT what happens to the rich, it is what happens to the poor. But our TV anchors won’t present such an objective view. Of course, if rich getting richer in Model A is due to cronyism, it should be questioned, but that’s a different issue.
5. Poll of Polls is the average of seats projected by different pollsters. How scientific is it?
It is scientific to the extent that we’re trying to even out the errors in the different surveys. It’s unscientific in that you should only average vote share, not seat share. Also, the methodology of different surveys may make such averaging somewhat unscientific.
6. For products which attracted a VAT of 10%, GST is now 12%. In principle, should the prices increase or decrease?
Assuming the average Input Credit is 5%, the prices should reduce by about 3%. But this could take a little time, as sellers would initially want to play it safe. Market forces should drive the prices down over time.
7. “Farmer suicides can be prevented.”
Not only am I pro-farmer, I’ve argued in my several articles (like Doubling Farmers’ Income and Farm Loan Waivers) that Agrarian distress should be the top priority of the Government. I believe all the Governments, including Modi Government, have failed them. But, we should not compromise with facts. When we talk of farmer suicides, please consider these facts:
Between 1987 and 2007, the suicide rate among Indians increased from 7.9 to 10.3 per 100,000.
We have to solve farmers’ problem, because in a democracy, the economic benefits of development should reach all sections uniformly.
So, farmer suicides are only about 20% of suicides by Indians, as a whole. Maybe, the suicide rate is inversely proportional to wealth. It’s worth studying. Below a certain %, it is difficult to reduce any aberration, whether it is suicides, rape, murder, or whatever. There’s a cost to reducing farmer suicides (like farm loan waivers), and a different cost to improving the standard of living of the farmer (there are many other options). If we try to address the wrong problem, we’ll spend more but accomplish less.
We have to solve farmers’ problem, not because of their high (?) suicide rate, but because in a democracy, the economic benefits of development should reach all sections uniformly.
Similarly, when we hear of deaths during demonetization, the suicide of defense/ police personnel, we should learn to normalize the numbers against the rest of the society and discern if it is more or less than normal, rather than be emotionally swayed instantly. Honest, responsible and competent media should present all relevant facts, not just what they want people to believe.
So, the next time whenever anyone (incl TV anchors) throws a statistic at you, ask yourself the question, “Is this enough to come to the conclusion I’m led towards?”
Note:
1. Text in Blue points to additional data on the topic.
2. The views expressed here are those of the author and do not necessarily represent or reflect the views of PGurus.
- How BJP can get 33%+ vote share in TN - April 1, 2024
- A transparent, equitable electoral funding alternative - March 19, 2024
- How TN BJP can come to No. 1 or No. 2 in 2024 LS polls - January 11, 2024


Good analysis.