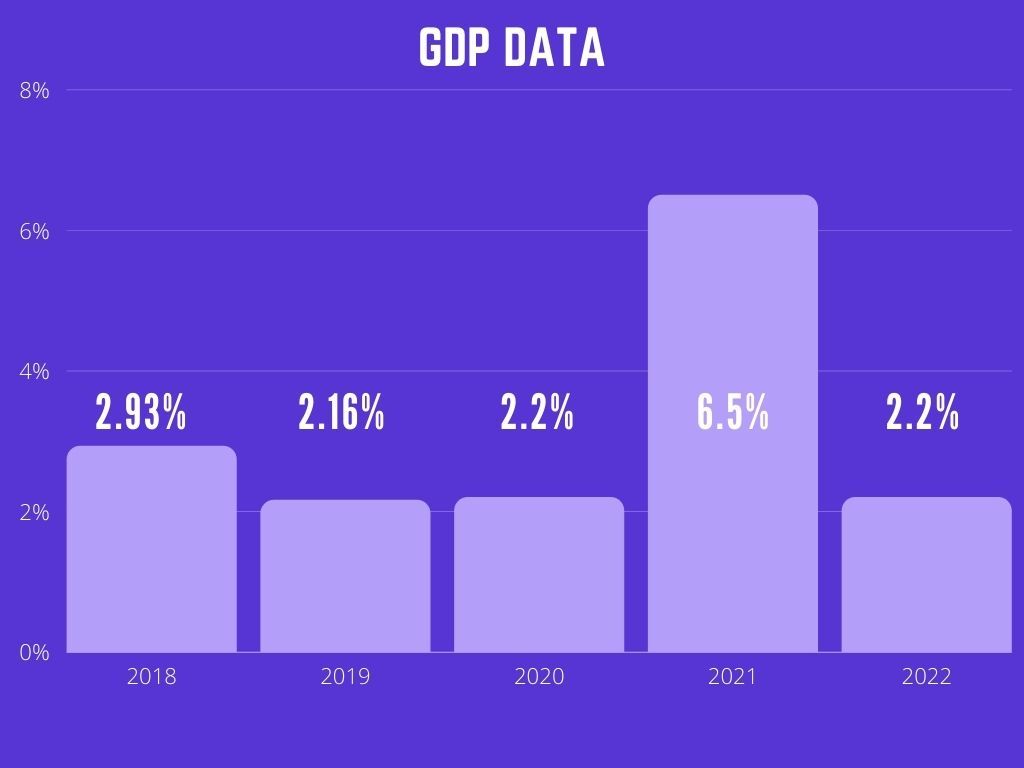
Data of GDP
The data is always fascinating to read when one looks at the context and of course, political quagmires hide the truth.
Especially when the hatred for President is supplanted with a rotten and disruptive social agenda.
One has seen consecutive 44 days of an increase in gasoline prices with – ban the fracking and crack the socialism agenda – ups the ante

When was this rate last seen – 1986, 7.24% rising from 4.58% in 1985 and followed by a dip to 4.17% in 1987?
As more debt gets added with Monetary tools running out – Asset Purchase/ Rates etc – where is the US heading – Fastest train wreck to 200% debt to GDP or even higher and interest costs perhaps the #1 line-item on Spending[1].
Welcome to Néw Unionized Progressive agenda vision of Mr. Obama.
@DonaldJTrumpJr @kimguilfoyle @MariaBartiromo @LouDobbs @almasonteam – how come no one is speaking about this @mikepompeo @LindseyGrahamSC https://t.co/jLvyafw5g0
— Sridhar Chityala (@schityala) March 18, 2021
Note:
1. The views expressed here are those of the author and do not necessarily represent or reflect the views of PGurus.
References:
[1] EP-121: Fed to leave rates unchanged till 2023. India-BD border sees highest illegal immigration – Mar 19, 2021, PGurus.com
- World Bank Courts controversy - September 18, 2021
- China’s pervasive influence in just about everything - September 18, 2021
- The six point plan of Mr Biden and his ulterior economic agenda - September 10, 2021


