R.Vaidyanathan
Professor of Finance, IIM-Bangalore
When we talk about the return got from an asset –say shares we talk of arithmetic mean [AM] or what we call average return.
For instance if we buy a share for say Rs 100 and sells it for Rs 110 we say the percentage return is 10%. It is computed as [110 -100]/100 *100%. In general it is ending value of wealth minus beginning value divided by beginning value expressed as percentage.
If we go for a two year period then it gets complicated. Let us say we have the situation of the value of shares as 100/ 110/ 120 in the 2 year period. That is ₹100 invested in first period grows to 110 and if it is fully reinvested and grows to 120 at the end of second period. Then the returns are 10% for the first period and 9.09% [that is 10 divided by 110 in percentage] in the second period. That is an average of 19.09/2 = 9.55% during 2 years. Kindly note that money has increased from 100 to 120 but one cannot conclude 20% return for 2 years and 10 % P/A. It will be misleading.
But if the values were 100/ 120 / 100 then if we compute we get 20% return in the first year and minus 16.66% in the second year [100 – 120/ 120 * 100]. Again we may conclude that the annual return over 2 years is [20 — 16.66] / 2 = 1.7%. This will be considered absurd since we started with 100 and ended with same 100 and hence return should be 0% for the period.
The problem is with using arithmetic mean [AM] or simple averages in computing annual returns from a set of return over long periods.
Actually the best measure to use should be what is called Geometric mean [GM] or Compounded Annual Growth Rates [CAGR]. In our situation
100 = 100 [1 + r] 2 where “r” is the GM return. Solving we will get r to be zero.
In the earlier example 120 = 100[1 + r]2, solving we get GM as 9.54%. Kindly note that GM represent the returns from assets much better compared to AM.
But interestingly most of the market participants and experts use arithmetic mean only since it is easier to understand and convenient to compute.
As they say Satyajit Ray movies are more artful and logical/ rational but people go for Manmohan Desai block busters since it is easy to understand and convenient to grasp!
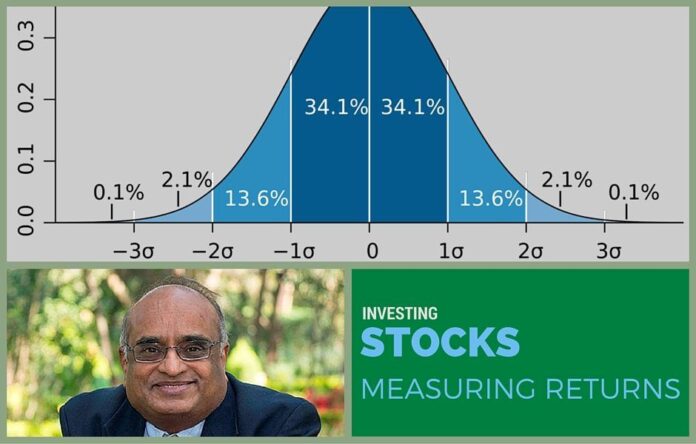
Let us now try to understand about measuring risk. Popular and most often used measure is Variance or its square root namely Standard Deviation.
This statistical measure was originally used in physical sciences to indicate deviation from standard or normal situations. For example the normal blood pressure is supposed to be in the range of 130 by 85 for people aged 50 to 55. The variation on either side is considered as undesirable. Suppose it is above 160 or below 100 then it would be considered as very large deviation from normal or mean and steps need to be initiated to bring it to normal.
Similarly for sugar content in blood – Fasting level is expected to be 70 to 130 and any deviation on either side is considered undesirable and steps to be taken to bring it to normal. The variance of a population is defined by the following formula:
N σ2 = Σ [Xi – X]2 / N i=1 Where σ2 is the population variance, X is the population mean, Xi is the ith element from the population, and N is the number of elements in the population. Many times the deviation from expected value is also taken.
The square root of this is commonly used to measure risk as deviation from mean since the square root will have same unit of measurement as mean. The square root is called Standard Deviation.
Measuring the risk in the share market for the return got is different ball game. In the share market if our expected return is say 15% and if we get 20% then it need not be considered as “bad” or undesirable deviation.
In other words in the case of risk of an asset only downside deviation from expected value is of importance and that needs to be minimized. Actually what we should worry is “semi Standard deviation” or deviations below the mean returns.
But practitioners as well as experts use by and large standard deviation as a measure of risk for taking decisions. Here again ease of computation and understanding takes precedence over rigor of understanding. Manmohan Desai scores over Satyajit Ray.
So in academic discipline also that which is used and popular need not be the one which is rigorous.
Views are personal.
- नकली खबर लक्षण है, बीमारी नहीं! - April 16, 2018
- Fake News/ Accreditation and Sedition - April 4, 2018
- Two Poisonous Seeds - March 15, 2018


So u would recommend sortino ratio instead of sharpe as a better benchmark as only negative asset return volatility matter?
So,what does central banks like rbi use in deciding inflation and all?and if it does follow ray principle isn’t the Desai scamster on bigger canvas.
Such a nice article, Rvaidya Sir.
I am not from finance background, but I was able to follow.
Thank you so much!